The best EPL Defences 2018-19 part 2

I recently wrote about the best PL(Premier League) defences in part 1. If you have not read it , please check it out here. I will begin where I left out last post. After all most of like a budget defender.  For the benefit of anyone who missed my custom table I will repost it here.

Screen Shot 2018-08-07 at 9.39.15 AM

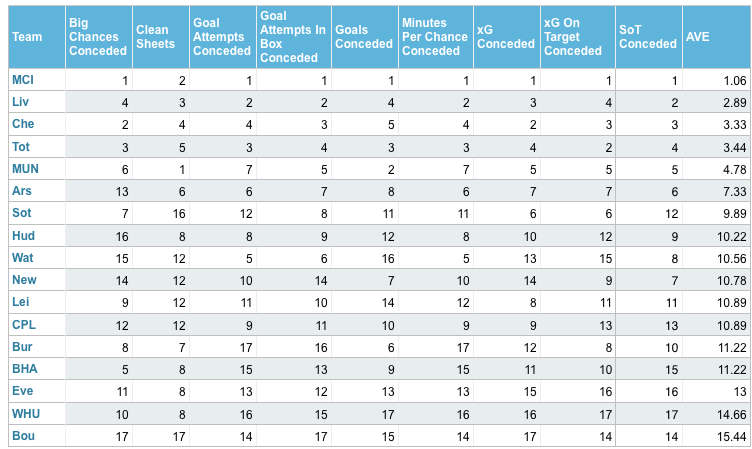
We covered the top 6 teams and the big surprise package that was Southampton who managed to come 7th in our rankings.

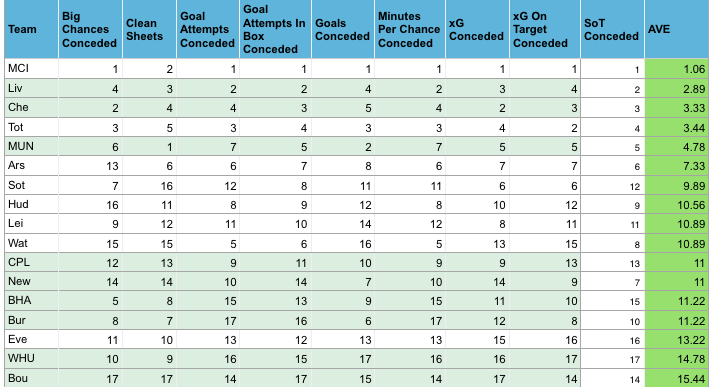
Now let us take a look at the ‘best of the rest’. There seem to be 3 or 4 clear groups so we shall deal with them likewise.

Newcastle, Leicester, Watford and Crystal Palace

All these 4 teams are pretty close together on the ratings and finished  12th  in the CS category with 9 apiece. They all rate between 10.56 to 10.89 in my rankings and that is reflected by their CS haul. All of them conceded an xG around the 50 mark with only Newcastle outperforming on that metric. They conceded only 47 goals even though their xG conceded ( xGcon) was 52.80. Was this down to just luck or good defending due to Rafa Benitez is not clear.

Leicester conceded 67 Big Chances and 286 SiB. They conceded 60 goals for an xGcon of 48.5 suggesting that their defence could potentially improve or that they are too attack minded for their own good.
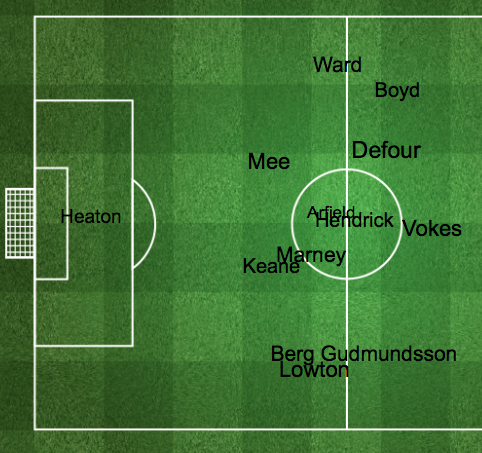
Burnley and BHA

These 2 teams are unique because even though they rank 11.22, Burnley got 12 CS and Brighton got 10. Burnley have been known to generate poor numbers but get good defensive returns season on season. Sean Dyche is rightly credited for this feat.  They allowed more than 550 shots at their goal averaging about 14.5 shots per match. Even their SoT conceded of around 160 is more than the league average of 150.3. However both these teams only conceded around 55 BC which could explain their CS return. Burnley especially conceded only 39 goals from an xGcon of 52.8! This means they have very busy defences but efficient, making their goalkeepers a good prospect.

The Burnley goalkeeping situation is precarious now, but whoever

Huddersfield

They only conceded 442 shots compared to the 571 Burnley let in , 285 SiB as opposed to the 302 allowed by BHA. They got 10 CS and rate higher than the aforementioned group with 10.22. Their undoing seems to be the league high 79 Big Chances let in which was on par with Bournemouth. Their xGcon on target was the 12th highest in the league. So the underlying numbers say that if Wagner can organise them a bit more , they could be a good defence. The other explanation could be that the central midfielders are doing so much defensive work that their attack suffers.

Everton and West Ham

These 2 teams conceded the most SoT with West Ham allowing 187 and Everton 178. They rank as the 15th and 16th best defences out of 17. But the big surprise is they still managed 10 CS.  West Ham conceded the most goals in the season with 68. WH let in 322 SiB which was worse than only 2 teams. Everton seem to have slightly better numbers.

Bournemouth

This was the worst defence in the league apart from the relegation candidates. They were so bad that I am surprised Eddie Howe is in the job. If they do not tighten the rearguard or if their attack cannot bail them out, then it looks like a relegation battle thsi year. They conceded the highest xG of 60, most BC of 79 and most Shots in Box of 337. To put that into perspective Liverpool only conceded 284 goal attempts IN TOTAL.

Key Points

  • Burnley , Brighton and Huddersfield have decent underlying stats and could get good returns. Their keepers will get both save and CS points.
  • Leicester have good stats and they could return CS against lesser opposition.
  • Newcastle, Everton may have overperformed and we have to wait.
  • West Ham have definitely done more than their numbers suggest and are better avoided.
  • Bournemouth- AVOID AT ALL COST!


Thanks for reading

–FD–


The Best Defences for 2018-19

Welcome back readers! I am back after a huge hiatus. I am going to try and keep this blog active or at least do some occasional posts on FPL and stats. Our Draft Day in our mini league recently concluded. I did  some research for it and decided to share it with you. Noticed an uptick in followers on twitter suddenly.

This short post will focus on the defences from last year and see what we can glean from it. Which are the best defences to invest in this year? Who should be the keeper you must bring in? I hope to answer this and more questions in this post.

The stats I am quoting are from FantasyfootballScout. They are an excellent source and the member’s subscription is worth it if you love data. Let us dive in. The numbers assigned in the table are the rankings of that club based on their defensive performance last year. Only 17 clubs are present as I removed the 3 relegated clubs and did not include the 3 promoted clubs. Stats from the Championship are not comparable to the stats from EPL and hence the omission.


Screen Shot 2018-08-02 at 11.18.33 AM
The Rankings of the defences in each category with average ranking on the extreme right.


The Guard of Guardiola

The Man City defence are ranked first for all parameters except clean sheets. More on that later. The City juggernaut was not just good going forward but their defence was amazing at shot suppression in both quality and quantity. They conceded the least Big Chances of 35 which is less than 1 per game! They conceded an expected goals (xG) of 23.9 and conceded only 27 goals. Those are some amazing numbers. Add in the attacking threat of Walker and Mendy and they start to look essential. One caveat to all those excellence is Ederson got to make fewer saves than other keepers around him but still finished as the second highest scoring goalkeeper.

The Big three

Liverpool, Chelsea and Spurs come next in that order. The smaller the number the better the defence as its an average of their ranking. Liverpool took me by surprise here. I am guilty of missing the Robertson bus last year and promptly finished in the bottom half of my mini league. The attacking trident seem to have stolen the glory similar to City but Klopp has a solid defence as well. The woes of their goal keeper are set to be solved with the purchase of Allison who might prove a smart acquisition for your team.

Chelsea under a new manager will look to continue their good work at the back. 3rd best defence last year because they conceded more Shots in Box (SiB) of 216 compared to the 184 conceded by Liverpool. Their xG conceded of 34 and 41 big chances(BC) conceded were second only to Man City. Could this be a reflection of their attacking wing backs not providing adequate cover? Overall even if their quantity of shots conceded was more than Liverpool the quality was same ,if not better suggesting a good centre back pairing and a defence worthy of investment. If I was Sarri I would look to find out why the numbers were bad ,potentially putting Alonso at risk.

Tottenham also profile similar to Chelsea and rank 4th in our list and could definitely warrant investment.

The De Gea conundrum

Manchester United strangely lurk at 5th in our ranking even though they were top for Clean Sheets with 19. Without their clean sheet rating they would rate further back at 5.25.  They had an xG conceded of 41.1 but only gave away 28 goals! Of the so called big 6 clubs they conceded the most goal attempts and second most SiB. Most analysts would say that De Gea could not possibly repeat the feat again.

Arsenal are in a league of their own. Being below the top 5 clubs but much better than the rest. They bagged the 6th most clean sheets(13) which agrees solidly with our data. Where they seem to fare badly is BC conceded of 71 which was the 13th most of the 17 clubs. To put it another way they conceded twice as many Big Chances as Man City who gave away 35.

Southampton posted very good underlying numbers and are rated 7th after the Big 6 but had only 8 CS which only more than Bournemouth, who were least with 6. This season we could see better returns from the Southampton defence and their wing backs in particular. Bertrand and Cedric had good attacking returns last season.

The Key Take aways

If you stuck around this far let me just cut straight to the chase for the best defences. We shall look at other clubs in the next post.

  • Man United defence does not look good statistically. If you feel you must invest in them, De Gea is the safest bet. He will get save plus CS points
  • Manchester City and Liverpool look really solid at the back and you must cover their defences.
  • Allison and Ederson could both be very safe keeper keeps guaranteed to get you points.
  • Chelsea and Spurs look good but not as good as the top 2. Worth investing but not unless you have covered the top 2.
  • Arsenal are the best of the rest and need Emery to sort out their Big Chances conceded.
  • Southampton have very good underlying numbers and they could prove shrewd buys.


Thanks for reading!

Centre-Backs and Their Unchanging Role

Today we have a guest post by @theShAnchorman . He takes a philosophical view of defenders here but seasoned managers know the value of a good defender especially this season where the likes of Marcus Alonso have the double whammy of attacking returns and clean sheets.Read on.

Football is not what it once used to be. With the advent of new styles, formations and tactics, the game is constantly changing – almost as if it were reinventing itself.

Take positions, for example. Many wingers have now evolved from being the suppliers to becoming the goal-scorers. You only have to look at Cristiano Ronaldo, Gareth Bale, Arjen Robben, Eden Hazard and Antoine Griezmann. Full-backs have become preponderantly attacking players, bursting forward to aid the wingers.

Perhaps the only outfield position that hasn’t changed is the centre-back. Even today, the role is the same as it always used to be– stay back, stop the forwards and rely solely on defensive capabilities. Almost all the time, you’ll find centre-backs to be the sturdy, robust controlling players on the field, although a certain Guardiola would beg to differ.

Central defenders, from a positional standpoint, are in the middle of the pitch and see the entire field in front of them; being thrown into a leadership position on the field so to speak. It is only apposite that they have always had to organize the team, constantly barking out instructions for the other players on the field, keeping everything in order. Generally, a mistake from the central defenders leads to an opposition goal.  Regardless of the style of the defender – be it a ball-playing defender like Gerard Pique, a traditional defender like Vincent Kompany or the skilful, unsure-of-his-own-position defender like Chelsea’s second-time signing David Luiz (Chelsea fans might beg to differ based on this season’s performances. Although I have a lot to say, that could be a topic for some other day), it is HE who has to control the game.

The significance of the centre-half clearly cannot be trivialized, yet is ignored often in terms of reward. Most people prefer to glorify attacking players be it Lionel Messi, Cristiano Ronaldo or Luis Suarez (Think Ballon d’or). This partisanship towards this style of player leads to defenders being unappreciated. The people who watch, report on and even run football are guilty of completely undervaluing the defensive side of the game. We are so enamoured by attackers and goals that we ignore the significance of its counterpoise.

An interesting stat that I came across recently said that clean sheets produce almost 2.5 points per match on an average as opposed to scoring a goal, which on an average earns a team about one point per match. This tells us only one thing – not conceding is more than twice as valuable as scoring a goal.

In other words: “Goals that don’t happen are even more important than goals that do.”

Yet, this fact is grossly overlooked by everyone in football.

At least one great centre-back features at the heart of every successful team. Yet, in a time when this game is constantly witnessing change, the position of the centre-back has stayed very much the same. And in spite of the forwards being worshipped as gods, the conventional centre-back has perhaps remained as the most important outfield position.

Penalty area touches and goal scoring

Hello reader we have finished 22 gameweeks and the new wildcard is available in Fantasy Premier League. 22 matches and you are familiar with the narrative by now. The cream have risen to the top and the bottom teams deserve to be in the bottom. Well the latter part is now being challenged what with Swansea beating Liverpool and Hull starting to show they are a decent team. Can Hull make it without Snodgrass though?

As you know in a previous post I looked at the relation between goals scored and penalty area touches (PaT). It is not the best acronym so suggestions are welcome. I found a relationship of around 100:8 i.e for every 100 PaT we can expect 8 goals to be scored.

This season

Coming to this season lets find out if any relationship exists.

Adjusted Goals (adG) is  Goals scored + (Hit woodwork-penalties scored- goals from direct free kick )

I have included all players who scored 4 or more adjusted goals. That was an arbitrarily set number and has no significance. Two defenders cropped in this set, Coleman and McAuley, who were both excluded.

screen-shot-2017-01-27-at-12-13-29-pm

The yellow dots are the forwards and blue dots are midfielders.

The players were classified according to the position assigned by Fantasy Premier League and may not reflect where they actually play on the field. Another difference I would like to point out is that within midfielders there is a lot of variation in position. Hazard and Walcott play as wingers with little defensive responsibilities and McArthur would predominantly play in the middle of the park.

This can be seen clearly by the lesser R2 value of around 40 % for midfielders.

Talking points

  • The distribution shows a clear pattern with very few outliers.
  • Delle Alli is the solitary midfielder with 14 adjusted goals(adG) from only 67 Pat.He has hit the woodwork 3 times! He surely warrants a place in our FPL team based on that form. But will it continue?
  • Paul Pogba has hit the woodwork 4 times and he has a robust 99 PaT. Expect him to start firing soon.
  • Apart from Ibra and Pogba only Mata finds a place here but he is at a distant 5 adG. That goes some way to explaining the woes of Manchester United.
  • Son has 8 adG from 82 PaT and is starting to look like a very viable replacement for Kane.

Is this a useful measure?

  • So for those of us who use stats in fantasy football is this useful and can it be a predictor?
  • Sanchez effectively played as a forward so a small switch in his position does this.

screen-shot-2017-01-28-at-2-23-58-pm

The R2 has now increased to around 63%. Not yet statistically significant but definitely getting better. The next aim down the line should be separating players into different buckets according to their positions and attributes.

Walcott, Hazard etc are wingers and cannot be compared to Pogba, Ozil etc.

A litmus test

Lets see if the value we had derived previously of 0.08 holds good. We are now considering only forwards

screen-shot-2017-01-28-at-3-01-50-pm

So there appears to be no correlation between adG and PaT (Trying to keep up with the acronyms?).
Let us take just good old goals, after all we do not get points for hitting the woodwork and we do get points for free kicks and penalties.screen-shot-2017-01-28-at-3-03-57-pm

Almost instantly we see there is some degree of correlation. I say some because there are brighter minds out there who can tell the exact statistical significance and I cannot.

Conclusion

• Penalty area Touches definitely have some relationship with goal scoring. This holds more true at the higher end of the spectrum which makes intuitive sense
• We can identify players who are underperforming. Firmino and Llorente did well in this regard and delivered with a brace apiece in Gw 22
• Certainly useful in terms of FPL predictions but more research is needed into this before we start basing our transfers on it

My strategy would be to identify potential goal scorers based on the traditional stats and use Penalty area Touches to sort them out further.


Thanks for reading.

-FD-


Statistical review and wildcard tips

Welcome dear reader to the first of a series of posts (well hopefully!) about the Premier League and the latest going ons ( or on goings). Let us take a short look around and find out who’s hot and who is not, who is the real deal and which players are showing they are worth the money?

1.What is this post about?

Lets start at the beginning. I am going to be using the stats that I feel are useful. ‘Statistics are like mini skirts , they reveal a lot but hide the essential’. Hopefully the stats here will help you make an informed choice about which players to get into your teams for Daily Fantasy Sports (DFS) games.

If you are playing fantasy premier league and draft leagues also the information should help in the prep during the break.Wildcard anyone???Statistics are also like constellations, some can see it clearly and the rest wonder what they are looking for!

2.Are Chelsea the real deal?

The burning question right now. As an Arsenal fan I am happy that they did not break the winning game streak record. The false narrative is that they are suddenly unravelling. 13 games have been won , in a row. They out-scored their opponents 32-4 in that run, keeping 10 clean sheets and scoring at least three goals on six occasions. They have demolished the opposition and climbed from 6th to the summit. Diego Costa and Hazard look rejuvenated and are must haves right now. If their price is a deterrent Pedro has been quietly consistent with 4 goals and 5 assists compared to Hazard who has 9 goals and 2 assists. Pedro also plays as a forward (not expected) when Costa is out suspended (as expected).

Coming to their defence they have only allowed 50 shots on target (SoT) in 20 games(Least in the league). That is 2.5 SoT per game which shows just how good their 3-4-3 is at restricting shots. Their expected goals (xG) against is 14.67 again the lowest in the PL. Conte has turned them around since the 3-0 drubbing at Arsenal and the loss to Spurs is more likely just a wobble. Delle Alli just got clinical and made the difference . This Chelsea team look set to continue their dominance.

3.Kane and Ibra

Harry Kane also has 10 goals which puts him in the top tier and just 4 behind Costa . Kane only has 2 assists so that can improve. Overall he has proven himself as a marquee player again and is worth a punt. Spurs are second for SoT both home and away.This shows they are a consistent threat as opposed to Man Utd who are first at home with 74 SoT/10 games and are 7th away with 46 SoT/10 games. This could be a reason why Man Utd are further down the table.

Kane has only 26 Shots inside Box (SiB) as opposed to Ibra who has 60 Shots inside the penalty box! Ibra wins this battle hands down and the numbers back the Swede.

4.Spurred on

Delle Alli is now the second highest goal scoring midfielder (10) after Sanchez (11). Alexis is basically a forward so that shows what a purple patch Alli is enjoying.

Eriksen had the most SoT for a midfielder last season and this year he is living up to the expectations by having an amazing season. He is a good example of sticking to someone with good underlying stats as numbers don’t lie. He had no goal output in the first few months and now…well…you know.Spurs have quietly come up t0 3rd in the table with a goal difference of + 25 which equals Pool and is only bettered by Chelsea. Their save % of 80 is the highest in the league and has helped them concede only 14 goals which is the least in the league, Chelsea let in 15.

5.Do Klopp and Kop have a chance or will it flop?

We all remember the 2013-14 season where Suarez and Sturridge almost took them to the title. ‘The slip’ of Steven Gerrard happened and Demba Ba scored, Chelsea won the match and Liverpool lost the title to Manchester City. Poetic justice then that Liverpool look the most likely to knock Chelsea out of their perch. Their midfield needs no introduction and we will come to that later. Recently their defence is picking up. Liverpool have conceded only 57 Sot ( 2nd least) and 156 shots against (least). The gegenpressing is clearly working.

It is the keeper issues which are costing them. Their save % ( saves / SoT against) is 66.1 % which is below the league average of 70 %. Except one team all the other top 6 teams have above average save %. Can you guess which one?

Bravo! I assumed you guess Manchester City who have a save % of 65.5 only. Only 4 teams are below them , surprisingly Southampton also are here with only 62.3 %.

This causes Liverpool to have a conversion rate against of 13.2 % . That means roughly for every ten shots against they concede 1.3 goals. All other Top 6 teams are conceding less than 9% of shots except……Man City again.

6.The Mane faced midfield minefield

Mane has 9 goals + 9 assists making him the most potent attacking outlet. He is heading to the African Cup of Nations (AFCON) though and could miss 3 to 4 gameweeks. Once he is back however there is no looking beyond him. Lallana is getting into his own now with 7 goals and 7 assists. I got him for Redmond in our draft league and that worked out well for me! 

Firmino has a quirky stat. He has 5 goals + 5 assists in roughly 13 games with Coutinho and only 1 goal in 6 games without his compatriot. Coutinho is set to return and hopefully this could be the boost Firmino needs. Why this is happening is harder to explain. Is it positional change or a tactical switch? Firmino has more Sot (26 vs 16), more shots (60 vs 43) and more SiB (43 vs 38) compared to Mane. I am expecting him to come good soon.

7. The woes of Pep

Pep is clearly a thinker and the criticism against him is unfair on a few levels. The truth though is undeniable that La Liga was a duopoly when he was there and Bayern are way ahead of the pack in Germany. The impression that Man City are struggling and are falling apart is the wrong one. They could not sustain the start they had but they are 4th in the table and on par with Spurs. They have let in 169 shots (2nd least)  but SoT  against is 60 (falls to 4th least) but its still not bad. As we have explored they have keeper issues. Now that has to be Pep’s fault if it persists but lets give Bravo some time. Lest we forget it is only his first season here and many combinations are happening for the first time. A decent defensive signing would pep them up.

8. United we stand

Manchester United and Jose Mourinho , a match made in heaven, or so it seemed. Pages have been written about Pogba, but its unfair to compare him to the other expensive buys. The others like Bale, Ronaldo, Suarez are all goal scorers and Pogba is not. So in the same way that the Ballon d’Or seems to only factor in goals we cant equate money spent to goal or assist output.  

We know Man Utd are very good at home and average away. Mata and Pogba having 4 goals apiece are the highest scoring midfielders. They look overly reliant on Ibra which is not the worst problem I guess. They have the 3rd most shots and SoT which bodes well. 2nd most Shots in Box which bodes really well. They are definitely  going to be a threat in the second half of the season.

9. The other Antonio

Michail Antonio now has 8 goals which equals Walcott. Only 4 midfielders are above him and he is the primary goal threat in the West Ham team. He has played in a variety of roles and somehow keeps scoring. Definitely one to watch and a certain Payet provides the chances for him.

10.Final thoughts

This post has become longer than I expected it to be. I did not cover certain aspects which we will come to later like Giroud. Llorente has very good underlying numbers and is being linked to Chelsea. Lets wait for the end of the transfer market and we will know which teams are likely to improve and which ones will fall away.

Please feel free to let me know your thoughts @FplDraft

EPL Statistical Review after GW 10

Welcome back reader(s), its been a while since I wrote something. Parenting and my day job have kept me busy this past month. Only good thing was that there was an international break in between and my fantasy football team did not fall off the rails.

So I am going to do something different this time. I am going to put up some data which has been gleaned by others. This way I can share with you where I get most data from and also its an acknowledgement of the effort of these analysts who make their work public for  all of us to enjoy and read. After that lets see what we can take from it.

Expected Goals(xG)

Lets begin with the darling of the analytics community, the expected goals models.

screen-shot-2016-10-27-at-1-10-15-pm

This is from the excellent @11tegen11 . It plots the xG difference between the team and opponent and then the mean is displayed.

screen-shot-2016-10-27-at-1-14-22-pm

This table is from the well known Michael Caley of @DoublePivotPodcast fame. His twitter handle is @MC_of_A .

You have picked out that the tables do not match and that is for a reason. These calculations are proprietary and are done by each individual so they may not match.

Manchester City

Whats eating Pep and City? Fatigue? Adjustment? Found out? The explanations are varied and we may not know exactly what is causing it. Without a doubt though there is a slowdown. They had an xG of 1.9 against Man Utd in GW4, 3.6 against Bournemouth in GW 5  and 2 (+ 1 pen) in GW 6. After that its been downhill! 1.1 against Southampton although they conceded to a defensive error by Stones and 0.8 against Barca after Bravo got sent off.

I wrote till the above point before GW 10 and then parenting got in the way! GW 10 is over now so thats a decent place to take stock of whats happening.

I think Man City are worthy of a separate blog post as I delve into the data. The slump seems to have been corrected by a 4-0 thrashing of WBA at the Hawthorns where we usually expect more resistance from a Pulis side. City sit comfortably on top of the table by @11tegen11. The table shows the difference in expected goals which means their defence is also not bad. They sit joint top with Burnley and Palace for errors leading to a chance with 4. The mistake by Stones leading to a Redmond goal is still fresh in the memory.

Some teething problems are likely as its only 10 matches under a new manager. The initial wining streak had us all reaching for the Pep-is-the-best betting slips but it looks like they have a solid process, great individual talent and another bucket load of money in Jan to buy . I would be happy to drop the bet on them.

Manchester United

Moving to the Red half of Manchester we are fresh off an exciting , end to end 0-0 draw against Burnley. Who am I kidding? Exciting and United in the same sentence? Full disclosure here, I hate Mourinho. Who does not? I wanted to pull up some data that he has spent more money than other managers to win the league and turns out I was not wrong but late. A google search revealed a dozen articles highlighting the same thing!

He has spent north of 850 million pounds since 2004. More than any other manager. That  is of course not a criticism. He has the faith of the owners to invest that amount of money and the ability to attract the top players even without UCL. Judging Pogba on his price tag is harsh as he is not a goal scorer. He is NEVER  going to be worth that amount of money in a traditional sense. The market is what it is. If Bolasie ( 27 year old Congo international who has won no trophies) is worth £25 million, then Pogba (23 year old homegrown player with 4 Serie A titles and 4 Cup trophies ) could be worth 4 times that amount. Also we have to account for the fact that Man Utd are the largest English club and they have to pay a premium every time simply because teams know they can afford it.

Their expected goals looks like a top 4 side and on any other day 11 SoT, 19 corners and 37 shots would have produced something. Burnley were surely lucky.

****A correction****

In a previous post which I wont plug here I had written that Sturridge had 34 Adjusted Goals in 2013-14. That was calculated wrong and should read 24. I put my hands up and say that was a rookie error. The good thing is it falls more in line with the expected data but the bad thing is the mistake happened in the first place. Apologies to anyone who lost an argument using that stat!

Chelsea

In preparation for a podcast that never happened we had decided to look at Chelsea and found out that their underlying stats were not bad at all. That was after the Arsenal drubbing . Now after 10 matches they sit 4th in the table just 1 point off the top.

At this stage last season they had 11 points. Caley had them as the highest xG and they are projecting like a top 3 team. Hazard has already crossed his goal tally from last season. Costa and Matic who had a bad season last year are also looking back to their best now. Conte looks like he has finally settled on his favoured formation and is even making Luiz look like a decent defender. What is up with Fabregas though? Any thoughts?

Chelsea were joint top with the Saints for least big chances conceded with 7. The two sides met this weekend and Chelsea packed them off with goals from Costa and Hazard. Mourinho saying Conte humiliated him is a bit much considering he called Wenger a voyeur once.

Chelsea are second for least open play goal attempts conceded. The first is….

Liverpool!

We have been enthralled by this Klopp team of intricate passing and free running. Doubts have existed about their defence though. Lovren’s mistake against McArthur doing nothing to dispel them. Here is their shots conceded from open play. Yellow dots are goals ,Blue are saves and green are blocked shots.

screen-shot-2016-10-31-at-12-05-08-pm
Liverpool shots conceded from Open Play by @footballfactman

They have conceded a lot of goals from right in front of goal. The tacticians can figure out what that means. We previously thought it was a GK issue but Karius does not look a great upgrade in that regard. Let us compare with teams who have keepers regarded as one of the best and are competition for top 4. Here is Lloris of Spurs

screen-shot-2016-10-31-at-12-05-41-pm
Tottenham shots conceded from Open Play by @footballfactman

Cech of Arsen

al

screen-shot-2016-10-31-at-12-13-20-pm
Arsenal shots conceded from Open Play by @footballfactman

xG models love their attack and they look on course for a top 4 finish but unless they sort out defensive issues a title seems unlikely

Final Arsenal Word

Their attack and improvement have been covered extensively so I wont go into it. Wenger has spent on a forward and the defensive midfielder that everyone wanted. Lucas Perez and Xhaka have come both have seen very less game time. The squad is largely the same as  last year with the wonderful exception of Mustafi ( Best defender buy this year in PL?). Is this Wenger proving his detractors wrong that Arsenal had a title winning squad last year or does that make you think if-only-he-had-bought-earlier?

You can find me on twitter @FplDraft.


Penalty area touches – a ‘D’ dive

In the previous posts we have discovered that there are other predictors of goal scoring apart from just Sot (Shots on Target) and SiB (Shots in Box).

Passes received in final third and penalty area touches also seem to correspond well. In GW 4 tips I pointed out that Capoue and Fer had very few underlying metrics go their way. Yet in GW 4 both scored against West Ham and Chelsea respectively.

There has to be one of 2 explanations

  1. They are continuing to run red hot as far as form goes. Leicester proved you can have form and Lady luck on your side for an entire season.
  2. There are other metrics we are missing.

Lets find out which.

Penalty area touches and final 3rd passes received for players scoring 3 goals

Lukaku  -32 and 39

Aguero  – 22 and  48

Capoue-  11 and 42

Fer        – 12 and 27

So Capoue has touched the ball more times in the final third compared to Lukaku. Penalty area touches are much much lower and all his goals have been first touch half volleys.

Taking his price into consideration I do think he is a good 5th midfielder and can score a few more. Fer on the other hand certainly seems to have a good vein of form and nothing else. I would stay away for now.

That part was written a few weeks back.I jus dug up this post again.

Penalty area touches

d-dive-pen-touches

The chart above represents the players who scored 10 and more Adjusted Goals in the past three seasons. As we can see there is some degree of correlation between penalty area touches and goals scored. Final third passes on the other hand I am not sure.

The outliers on the very right of the graph are Sanchez and Hazard over 3 years. That means the 14-15 Hazard, 13-14 Hazard, 15-16 Sanchez and 14-15 Sanchez. They were the only proper wingers I could notice in this set. Martial played as a left winger under Van Gaal. Wijnaldum played LW and CAM at Newcastle.Surprisingly Walcott did not feature regularly.

The big surprises there were Lukaku in 15-16 with 621 touches and Martial in 15-16 with 600 touches.The bottom dwellers were Yaya Toure in 13-14, Siggurdson 15-16 and other one season wonders who did not replicate their goal output. Ramsey 13-14 step forward.

I learnt this lesson the hard way as I invested a big chunk of my budget last year on Yaya and he went ahead and sunk my draft team.  The top most yellow dot is….any guesses?

Luis Suarez I hear you say? You are right. In that crazy season of 2013-14 he had a whopping 329 touches. That is the highest recorded in the past 3 years and you can see the gap between him and his nearest competitors. One quirky fact is Sturridge had only 159 touches in the penalty area in the same season yet he had 34 adjusted goals! MORE than Suarez. He is the bottom most yellow dot.

This suggests one of 2 things

  1. Sturridge is an insane finisher and highly efficent
  2. The chances created that season were of such high quality that he had very few touches to get the goals.

Could both be true? Could injuries be limiting one of the Premier League’s most lethal finisher? Suarez going to Barca as part of THAT attacking trident and creating great chances means the second reason is possibly true. Whatever be the reason that insane season is unlikely to be repeated.

What have we learnt?

There  is some  correlation between touches in the penalty area and goals scored

Sustained high goal scoring definitely is related to penalty area touches. This can be seen easily by the yellow and purple dots being entirely on top with a few exceptions.

Apart from using just shots we can also incorporate penalty area touches to get a better idea.

Sanchez appeared on this list in 15-16 even though he missed a few matches with injury.If he had a full season its possible he would have been a yellow dot!

The last point of interest is that most of the players who are yellow and purple dots are Forwards. They are costly but we can trust them to deliver. Aguero anyone? 

Statistical review of FPL GW 6

I am going to attempt something different today. There are plenty of reviews available about the GW in various sites. We are going to focus on the numbers only and lets see if we can learn anything.

Burnley Vs Watford

Burnley won this match 2-0.Goals scored by Michael Keane who is one to watch out for and Jeff Hendrick. Defour got both the assists and looks like the key to anything good from Burnley.

Watford did not exactly perform like the team that beat Man Utd.

screen-shot-2016-09-27-at-7-52-19-amStatszone

Sib – 5

Sot  – 3

All Shots- 11

Quite a few long range shots there.

FPL favorite Capoue had just a couple of long range shots that were blocked and created 2 chances. Pereyra created 2 chances and that was it. Ighalo had just one SoT but he has low ownership right now. Deeney looked the biggest threat with 3 Sib and 2 CC

(Note:Chances created or key passes only as per Statszone. Usually CC means Key Passes + + assists but think SZ use a different terminology).

Burnley had a performance which stood out for one thing.

screen-shot-2016-09-27-at-8-03-20-am
Statszone- Player influence Burnley

Look at how compact the average positioning is. We saw this against Liverpool where they managed a similar 2-0 scoreline. Could they be a good bet for home CS(Clean sheets)?

Screen Shot 2016-09-27 at 8.06.24 AM.png
Burnley attacking dashboard

8 Sib

4 Sot

13 Shots in total.

Good number of Shots in Box there. This was without Gray who was their main goal threat in the Championship.Defour was the main creator with 4 KP(key passes) and 2 assists.He also had 2 shots in Box. An interesting stat pointed out by Ted Knutson was PINTO or Passes INTO the Box. On this count Defour had 13 which looks quite good.

Jeff Hendrick had a solitary shot which was his goal.Keane on the other hand had 3 Sib for a defender!

Key Points

1.Defour looks a good differential in FPL when Burnley are at home. If you play DFS then he is certainly a safe bet to bag an assist.At a cost 0f 6 he is averaging 5 PPG.

2. This was a poor performance by Watford. It was not a defensive shell they faced like Liverpool did where they had almost 80% possession. They may need some time to settle into the 3-5-2 .

3.Sean Dyche deserves credit here. He figured out how to play against 3 men at the back when Jose himself had a few troubles.

4.Michael Keane looks like a defender with a decent set piece threat at 4.9. Heaton though looks the best route into the defence at 4.6.


This is a first attempt so any feedback would be greatly appreciated.Will cover more matches as and when possible.

Revisiting best predictors of goals-Part 3


I will assume you have read part 1 and part 2 and then landed here. If you are new to this site then a big welcome! We have figured out a formula for shots, shots in box and shots on target in the previous post. Today we are going to delve deeper into positional data of some kind. Shots can be taken from anywhere, just ask Coutinho and Townsend who seem to let it fly the moment they can glimpse the goal.

Expected goal models though tell us that the closer and straighter you are to goal the more chance you have of scoring. Makes sense.

A small recap of expected goals or xG.

exp-goals
The various zones as shown by http://www.americansocceranalysis.com


Zone 1- The  6 yard box right in front of goal


Zone 2- region between 6 yard box and 18 yard line or D Box or penalty area

Zone 3-The remainder of the penalty area to the left and right of goal

Zone 4-from the penalty area to the final third line (imaginary line)

Zone 5,6 – remainder of the area.

Just looking at the picture you can understand that the highest probability of goal scoring will come from shots inside Zone 1 and Zone 2.

Shots in Box     =     Shots in Zone 1+ zone 2 + zone 3

This could be one reason why SiB seems to be much more constant across seasons (0.23 to 0.24 conversion rate). That means roughly 1 out of 5 SiB will be a goal from an elite player.

The Other data

For a player to take high quality shots he has to get into good shooting positions. What is the final 1/3rd?


final-3rd
The final third is represented here as the offensive third. Flanks are included in the final third.

Lets look at passes received in the final third , the number of touches in the penalty area and the number of times the player got dispossessed.

Why?

My thinking is that a player can get into a good position but a defender may tackle him or the pass may not be a good one. Take Sanchez for example. He usually takes a lot of shots and has the best chance creator in Europe in the form of Ozil. Yet he never seems to take the league by storm although he can be explosive.

I watch Arsenal play and feel like he loses the ball a lot by dribbling too much when he should just shoot or pass. Hence I added that stat.

Ok time for some data heavy charts. If you do not like looking at the numbers just skip ahead to the interpretation

screen-shot-2016-09-10-at-12-27-45-pm
The total and averages for the 4 metrics we are seeing today

Interpretation of data

Ok so what do all the numbers mean? Even I am wondering the same thing. When we saw the various shot metrics the pattern just jumped out at us. Not so clear here. Clearly the positions of the players and where they touch the ball seems to have more variance.

In the so called ‘Eye Test’ this makes sense. Inverted wingers like Hazard, Sanchez who figure prominently here play more on the flanks. They will get a lot on the ball in the final third but may not touch the ball in the penalty area as much as say Diego Costa or Giroud.

1.Big Chances seem to be relatively constant across the 3 seasons. A big chance is defined by Opta as: A situation where a player should reasonably be expected to score usually in a one-on-one scenario or from very close range

2.To Score 10 or more goals a player needs to get 16-17 big chances.

3.On average good goal scorers get dispossessed 65 to 70 times in a season. In other words we can expect them to lose the ball twice a match. Not so bad when you say it that way.

4.I think the stats are skewed because of the 2013-14 season where Suarez and Sturridge just went red hot all season long. Even Gerrard figures on this list with penalties and free kicks making up 9 of his 13 goals.

5.The above data is the average of the players and not adjusted goals.

Let us now see if a pattern exists between adjusted goals and these metrics

The Ratios

This is of course what we need. How many penalty area touches does a player need to get a goal? How many passes should he receive in the final third to get a goal?

screen-shot-2016-09-10-at-12-52-51-pm

The Ratios mean something!

So this is as definitive as it gets for me. There are over 30,000 data points in the final 3rd passes received. Penalty area touches has 11,000 data points over 3 seasons. I do not think that is a small sample size.

800 words already. If you read this far you must have understood the gist of what I am getting at.

Conclusions

After rambling on for 3 posts lets review what we have learned.

1.Shots in box are converted at a rate of 0.23 to 0.25 and seem to be the best shot metric

2.Shots on Target are converted at a rate of 0.39 to 0.43

3. All Shots are converted at a rate of 0.16 to 0.17. This also seems to hold up across seasons.

4.Big Chances are converted at a rate of 0.83 to 0.86

Now coming to the most consistent and to me the most surprising numbers.

5. For every 100 penalty area touches we can expect 8 goals to be scored

6. For every 100 passes a player receives in the final third we can expect 3 goals to be scored.

Caveats

I wanted to finish with these caveats as they are important.

As already mentioned I am not a mathematician so any help from you is greatly appreciated. The differences in decimal points may be small but could make a big difference on a weekly basis.

We only looked at elite players here and we arbitrarily defined them as scoring more than ten goals.

This is only 3 seasons worth of EPL data as our main focus is FPL and not public stats analysis.

In the next post I will try to work out a formula from all our findings and do a retrospective analysis if the numbers hold up.

Thank you for reading.

Revisiting best predictors of goals -Part 2

In case you are reading this blog for the first time please read Part 1 first. This post is a continuation of where we left off.

The most important factor with any stat is how robust it is. We saw the conversion rate of the players who scored 10 or more goals for 2015-16. Lets now confirm if our finding is correct by going back to previous seasons.

All data is from fantasyfootballscout.co.uk who in turn get it from Opta.

screen-shot-2016-09-07-at-12-44-29-pm

A sidetrack

The moment I created this table I noticed something. I’m calling it created because I wrote out every number by hand, have not yet figured out this copy-paste in MacBook! Some players really just ran hot. Cisse, Diouf and Ulloa in particular stand out as having a hot streak. Of course we have the benefit of hindsight but if only I had seen this table at the start of 2015-16 FPL, my season may have been very different. Benteke seems to have produced solid numbers and looks a great buy by Palace.

Can the averages stand?

screen-shot-2016-09-07-at-1-18-21-pm

So lets calculate like we did last time.

Shots to Adjusted Goals Ratio -0.16

Sib to Adjusted Goals Ratio      – 0.24

SoT to Adjusted Goals Ratio     – 0.43

Wow! I just feel like I made a huge discovery! The numbers almost match!

So lets see what we know. We have now taken 2 seasons worth of data of around 22 players each. That is a small sample but as I have been saying we are only interested in the elite players from an FPL point of view. Next step would be to see if we can add a few more seasons worth of data and see if the numbers hold up.

Lets look at the conversion factors from 2013-14 ,remember this is the season where Suarez and Sturridge tore up the Premier League.

Shots  to A.Goals  – 0.16

Sib to A.Goals      – 0.25

SoT to A.Goals     – 0.39

There is definitely a pattern emerging. So our best predictor of goals so far seems to be just Shots and Shots in Box.

What have we learned so far?

So if a player is converting all shots at a rate above 0.16 or SiB above 0.24 , it is probably not sustainable.

We have a ballpark figure of how elite players convert their chances. Maybe a few more seasons worth of data and we could really be on to something with wider implications than just FPL.

I’m trying to find Kane and his stats are are not good. He has only has 6 shots, 2 SiB and 1 SoT. No wonder he is not scoring! He is not shooting enough.

Rondon on the other hand, has 11 SiB and just the solitary goal. I was thinking of removing him from my FPL team until I saw this. He looks likely to score and given the fixtures West Brom have I’m going to persist with him.

What did you learn today?